
US Attorney Connecticut Forfeits $600,000 in Tether Linked to Ledger

Polkadot price prediction as DOT charts send mixed signals
(Originally posted on : Invezz )
Polkadot price has crashed and formed a highly bearish pattern, pointing to more downside in the near term. DOT token has crashed by almost 60% from its highest swing in November last year. It is loitering near the lowest swing since November last year. So, what next for the Polkadot coin?
Polkadot price analysis: death cross pattern forms
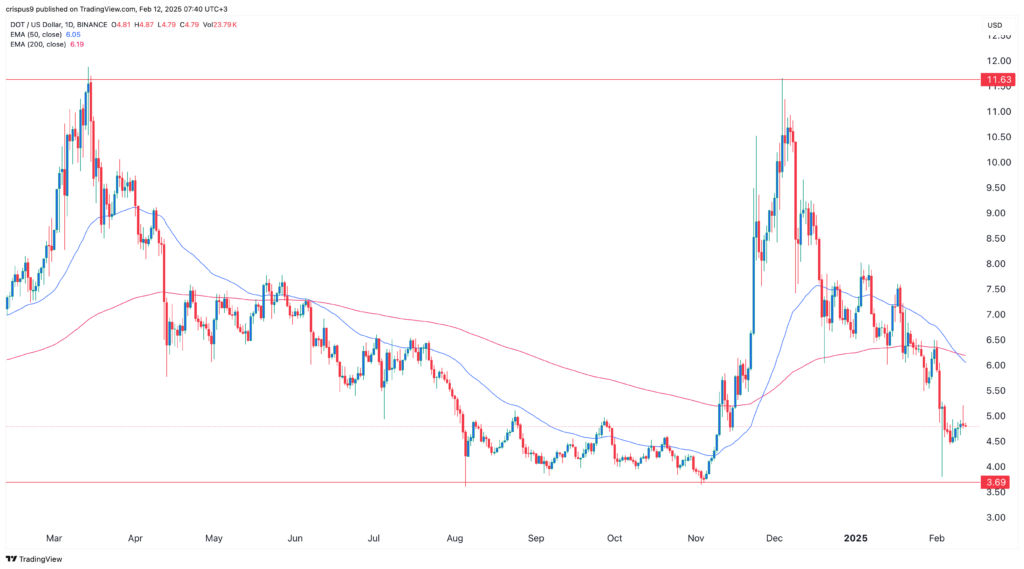
The daily chart reveals that the Polkadot price peaked at $11.65 in December last year as most altcoins soared. It then slumped, and recently, formed a death cross pattern as the 50-day and 200-day Exponential Moving Averages (EMA) crossed each other. A death cross is often seen as the most bearish chart pattern in the market.
Polkadot price has also formed a bearish flag chart pattern. This pattern usually forms after an asset dives, and is characterized by a long vertical line and some consolidation.
Most notably, the token is nearing the key support level at $3.70, its lowest swing in August, September, and November last year. Therefore, a drop below that price will be a victory to DOT bears as it will point to more downside in the near term. More downside may see it crash to the next key support level at $3.00.
On the flip side, a move above the resistance level at $6 will point to more gains ahead. This is a crucial level since it is along the 50 and 200-week Exponential Moving Average levels. A rebound above that price will boost the chance that Polkadot will bounce back to $11.6.
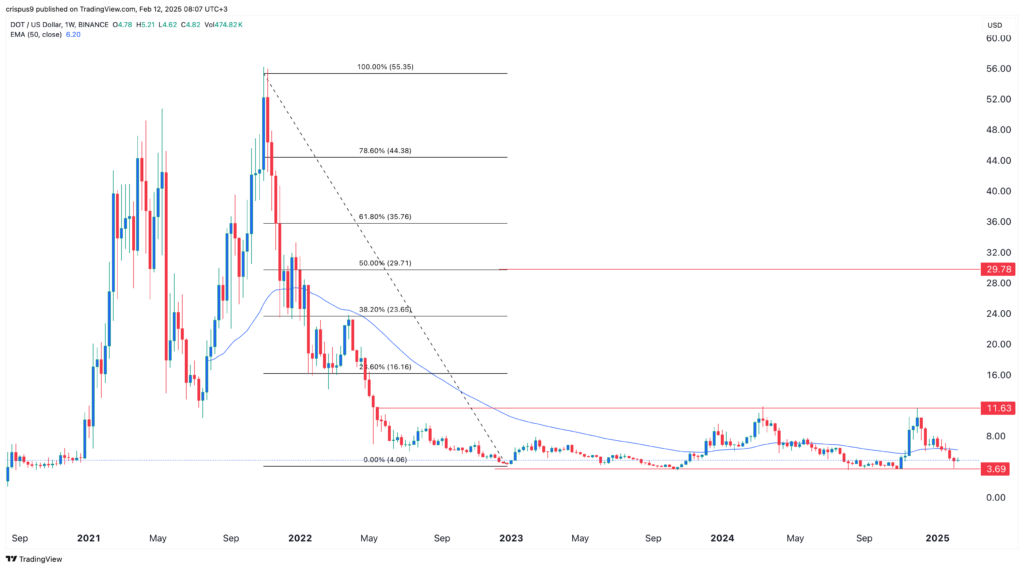
DOT price is in an accumulation phase
The weekly chart reveals that the DOT price has remained in a tight range in the past three years. It has remained between the key support at $3.70 and the resistance level at $11.65. It has constantly failed to break above these levels.
For example, the Polkadot price failed to climb above that resistance in April and December last year. This prolonged consolidation could be a sign that the coin is in an accumulation phase of the Wyckoff Method.
The Wyckoff Theory suggests that an asset goes through four key stages: accumulation, markup, distribution, and markup. A strong rebound above the key resistance at $11.65 will point to more gains as it will signal that it has entered the markup phase.
If this happens, the next level to watch will be at $30, the 50% retracement level that is about 510% above the current level.
A drop below the support at $3.70 will be a sign that bears have prevailed and that it will continue falling. It will invalidate the Wyckoff Theory.
Polkadot catalysts
Polkadot price has several catalysts that may push its price higher in the coming months. The most notable of this catalyst is the Polkadot 2.0 update that introduced new features like async backing, agile coretime, and elastic scaling.
Async baking reduced block times from 12 seconds to 6 seconds, while agile coretime allows dynamic core allocation for shorter durations through on-chain purchases. Elastic scaling enables projects to lease additional cores as needed.
These features, together with the JAM upgrade will make Polkadot a real alternative to other layer-1 networks like Solana and Ethereum.
The other potential catalysts for the Polkadot price will be the potential ETF approval by the Securities and Exchange Commission (SEC). While no DOT ETF has been applied so far, there is a likelihood that firms will apply for it. Besides, it is one of the biggest Made in USA coins in the crypto industry.
The post Polkadot price prediction as DOT charts send mixed signals appeared first on Invezz


 Bitcoin
  Ethereum
  Tether
  XRP
XRP  BNB
BNB  USDC
USDC  Solana
  Figure Heloc
  Dogecoin
  USDS
USDS  WhiteBIT Coin
  LEO Token
  Bitcoin Cash
  Cardano
  Wrapped stETH
  Hyperliquid
  Wrapped Bitcoin
  Binance Bridged USDT (BNB Smart Chain)
  Ethena USDe
  Canton
  Stellar
  MemeCore
  Wrapped eETH
  USD1
USD1  sUSDS
sUSDS  Litecoin
  Zcash
Zcash  Coinbase Wrapped BTC
  Hedera
  Avalanche
  WETH
WETH  Shiba Inu
  Sui
Sui  World Liberty Financial
  USDT0
USDT0  Toncoin
  Bittensor
  Circle USYC
  PAX Gold
  BlackRock USD Institutional Digital Liquidity Fund
  Ethena Staked USDe
  Polkadot
  Global Dollar
  OKB
OKB  Falcon USD
  Pi Network
  Sky
Sky  Aster
Aster  HTX DAO
  NEAR Protocol
  syrupUSDC
  Aave
Aave  Pepe
Pepe  Ripple USD
  Ondo US Dollar Yield
  BFUSD
BFUSD  Ondo
Ondo  Janus Henderson Anemoy Treasury Fund
  Gate
Gate  USDD
USDD  Quant
Quant  KuCoin
  Superstate Short Duration U.S. Government Securities Fund (USTB)
  Jupiter Perpetuals Liquidity Provider Token
  Algorand
  POL (ex-MATIC)
  Pump.fun
  Render
  Spiko EU T-Bills Money Market Fund
  Jito Staked SOL
  USDtb
USDtb  NEXO
NEXO  Worldcoin
  Binance-Peg WETH
  Cosmos Hub
  Rocket Pool ETH
  Midnight
  Binance Bridged USDC (BNB Smart Chain)
  Ethena
  Aptos
Aptos